Malware Classification with Machine Learning#
We need to develop an ML model for classifying Malware classifier dataset built with header fields’ values of Portable Executable files. As opposed to signature-based scanning, which looks to match signatures found in files with that of a database of known malware, heuristic scanning uses rules and/or algorithms to look for commands which may indicate malicious intent.
Signature-based detection uses a known list of indicators of compromise (IOCs). These may include specific network attack behaviors. They may also include email subject lines and file hashes.
A heuristic-based IDS solution goes beyond identifying particular attack signatures to detect and analyze malicious or unusual patterns of behavior. This type of system applies Statistical, AI and machine learning to analyze giant amounts of data and network traffic and pinpoint anomalies.
Thus we are using heuristic-based IDS solution for this assignment. There are a total of 55 Raw Features which are clustered as IMAGEDOSHEADER (19), FILE_HEADER (7) and OPTIONAL_HEADER (29).Finally we have a target variable with class - 0 (benign), 1 (malware)We will be preprocessing the data, using different ML models and cross-validating our model in order to evaluate the models developed.
Collect and prepare the data#
import numpy as np
import pandas as pd
import matplotlib.pyplot as plt

from sklearn.model_selection import StratifiedKFold, cross_val_score
from sklearn.feature_selection import SelectKBest, SelectPercentile, chi2, mutual_info_classif
from sklearn.svm import SVC
from sklearn.pipeline import Pipeline

import warnings
warnings.filterwarnings('ignore')
df = pd.read_csv("ClaMP_Raw-5184.csv")
df.head()
| e_magic | e_cblp | e_cp | e_crlc | e_cparhdr | e_minalloc | e_maxalloc | e_ss | e_sp | e_csum | e_ip | e_cs | e_lfarlc | e_ovno | e_res | e_oemid | e_oeminfo | e_res2 | e_lfanew | Machine | NumberOfSections | CreationYear | PointerToSymbolTable | NumberOfSymbols | SizeOfOptionalHeader | Characteristics | Magic | MajorLinkerVersion | MinorLinkerVersion | SizeOfCode | SizeOfInitializedData | SizeOfUninitializedData | AddressOfEntryPoint | BaseOfCode | BaseOfData | ImageBase | SectionAlignment | FileAlignment | MajorOperatingSystemVersion | MinorOperatingSystemVersion | MajorImageVersion | MinorImageVersion | MajorSubsystemVersion | MinorSubsystemVersion | SizeOfImage | SizeOfHeaders | CheckSum | Subsystem | DllCharacteristics | SizeOfStackReserve | SizeOfStackCommit | SizeOfHeapReserve | SizeOfHeapCommit | LoaderFlags | NumberOfRvaAndSizes | class | |
|---|---|---|---|---|---|---|---|---|---|---|---|---|---|---|---|---|---|---|---|---|---|---|---|---|---|---|---|---|---|---|---|---|---|---|---|---|---|---|---|---|---|---|---|---|---|---|---|---|---|---|---|---|---|---|---|---|
| 0 | 23117 | 144 | 3 | 0 | 4 | 0 | 65535 | 0 | 184 | 0 | 0 | 0 | 64 | 0 | NaN | 0 | 0 | NaN | 256 | 332 | 4 | 2006 | 0 | 0 | 224 | 8450 | 267 | 8 | 0 | 1100288 | 225792 | 0 | 1069880 | 4096 | 1110016 | 1184890880 | 4096 | 512 | 4 | 0 | 0 | 0 | 5 | 1 | 1335296 | 1024 | 1194954 | 3 | 64 | 1048576 | 4096 | 1048576 | 4096 | 0 | 16 | 0 |
| 1 | 23117 | 144 | 3 | 0 | 4 | 0 | 65535 | 0 | 184 | 0 | 0 | 0 | 64 | 0 | NaN | 0 | 0 | NaN | 184 | 332 | 4 | 1999 | 0 | 0 | 224 | 8462 | 267 | 5 | 10 | 4096 | 2560 | 0 | 7680 | 4096 | 8192 | 268435456 | 4096 | 512 | 4 | 0 | 0 | 0 | 4 | 0 | 20480 | 1024 | 0 | 2 | 0 | 1048576 | 4096 | 1048576 | 4096 | 0 | 16 | 0 |
| 2 | 23117 | 144 | 3 | 0 | 4 | 0 | 65535 | 0 | 184 | 0 | 0 | 0 | 64 | 0 | NaN | 0 | 0 | NaN | 272 | 332 | 5 | 2012 | 0 | 0 | 224 | 8450 | 267 | 9 | 0 | 27648 | 20480 | 0 | 28859 | 4096 | 32768 | 268435456 | 4096 | 512 | 5 | 0 | 0 | 0 | 5 | 0 | 61440 | 1024 | 67688 | 2 | 320 | 1048576 | 4096 | 1048576 | 4096 | 0 | 16 | 0 |
| 3 | 23117 | 144 | 3 | 0 | 4 | 0 | 65535 | 0 | 184 | 0 | 0 | 0 | 64 | 0 | NaN | 0 | 0 | NaN | 184 | 332 | 1 | 2011 | 0 | 0 | 224 | 8450 | 267 | 9 | 0 | 0 | 87552 | 0 | 0 | 4096 | 4096 | 268435456 | 4096 | 512 | 6 | 1 | 6 | 1 | 5 | 0 | 94208 | 512 | 113668 | 2 | 1344 | 1048576 | 4096 | 1048576 | 4096 | 0 | 16 | 0 |
| 4 | 23117 | 144 | 3 | 0 | 4 | 0 | 65535 | 0 | 184 | 0 | 0 | 0 | 64 | 0 | NaN | 0 | 0 | NaN | 224 | 332 | 5 | 2012 | 0 | 0 | 224 | 258 | 267 | 10 | 10 | 11776 | 36352 | 0 | 13379 | 4096 | 16384 | 4194304 | 4096 | 512 | 6 | 2 | 6 | 2 | 6 | 2 | 57344 | 1024 | 69089 | 2 | 33088 | 262144 | 8192 | 1048576 | 4096 | 0 | 16 | 0 |
df.shape
(5184, 56)
Feature Transformation#
We will first observe the missing values in the dataset
df.isna().sum()
e_magic                           0
e_cblp                            0
e_cp                              0
e_crlc                            0
e_cparhdr                         0
e_minalloc                        0
e_maxalloc                        0
e_ss                              0
e_sp                              0
e_csum                            0
e_ip                              0
e_cs                              0
e_lfarlc                          0
e_ovno                            0
e_res                          5184
e_oemid                           0
e_oeminfo                         0
e_res2                         5184
e_lfanew                          0
Machine                           0
NumberOfSections                  0
CreationYear                      0
PointerToSymbolTable              0
NumberOfSymbols                   0
SizeOfOptionalHeader              0
Characteristics                   0
Magic                             0
MajorLinkerVersion                0
MinorLinkerVersion                0
SizeOfCode                        0
SizeOfInitializedData             0
SizeOfUninitializedData           0
AddressOfEntryPoint               0
BaseOfCode                        0
BaseOfData                        0
ImageBase                         0
SectionAlignment                  0
FileAlignment                     0
MajorOperatingSystemVersion       0
MinorOperatingSystemVersion       0
MajorImageVersion                 0
MinorImageVersion                 0
MajorSubsystemVersion             0
MinorSubsystemVersion             0
SizeOfImage                       0
SizeOfHeaders                     0
CheckSum                          0
Subsystem                         0
DllCharacteristics                0
SizeOfStackReserve                0
SizeOfStackCommit                 0
SizeOfHeapReserve                 0
SizeOfHeapCommit                  0
LoaderFlags                       0
NumberOfRvaAndSizes               0
class                             0
dtype: int64
for col in df.columns:
    print('Column:', col, '\nNumber of unique characters:', len(df[col].unique()))
    print()
Column: e_magic
Number of unique characters: 1

Column: e_cblp
Number of unique characters: 9

Column: e_cp
Number of unique characters: 7

Column: e_crlc
Number of unique characters: 1

Column: e_cparhdr
Number of unique characters: 3

Column: e_minalloc
Number of unique characters: 4

Column: e_maxalloc
Number of unique characters: 3

Column: e_ss
Number of unique characters: 2

Column: e_sp
Number of unique characters: 8

Column: e_csum
Number of unique characters: 3

Column: e_ip
Number of unique characters: 4

Column: e_cs
Number of unique characters: 4

Column: e_lfarlc
Number of unique characters: 3

Column: e_ovno
Number of unique characters: 2

Column: e_res
Number of unique characters: 1

Column: e_oemid
Number of unique characters: 2

Column: e_oeminfo
Number of unique characters: 3

Column: e_res2
Number of unique characters: 1

Column: e_lfanew
Number of unique characters: 39

Column: Machine
Number of unique characters: 3

Column: NumberOfSections
Number of unique characters: 22

Column: CreationYear
Number of unique characters: 36

Column: PointerToSymbolTable
Number of unique characters: 9

Column: NumberOfSymbols
Number of unique characters: 13

Column: SizeOfOptionalHeader
Number of unique characters: 2

Column: Characteristics
Number of unique characters: 42

Column: Magic
Number of unique characters: 2

Column: MajorLinkerVersion
Number of unique characters: 23

Column: MinorLinkerVersion
Number of unique characters: 36

Column: SizeOfCode
Number of unique characters: 936

Column: SizeOfInitializedData
Number of unique characters: 930

Column: SizeOfUninitializedData
Number of unique characters: 194

Column: AddressOfEntryPoint
Number of unique characters: 3480

Column: BaseOfCode
Number of unique characters: 124

Column: BaseOfData
Number of unique characters: 385

Column: ImageBase
Number of unique characters: 404

Column: SectionAlignment
Number of unique characters: 6

Column: FileAlignment
Number of unique characters: 7

Column: MajorOperatingSystemVersion
Number of unique characters: 10

Column: MinorOperatingSystemVersion
Number of unique characters: 10

Column: MajorImageVersion
Number of unique characters: 41

Column: MinorImageVersion
Number of unique characters: 53

Column: MajorSubsystemVersion
Number of unique characters: 6

Column: MinorSubsystemVersion
Number of unique characters: 5

Column: SizeOfImage
Number of unique characters: 675

Column: SizeOfHeaders
Number of unique characters: 19

Column: CheckSum
Number of unique characters: 3255

Column: Subsystem
Number of unique characters: 6

Column: DllCharacteristics
Number of unique characters: 25

Column: SizeOfStackReserve
Number of unique characters: 33

Column: SizeOfStackCommit
Number of unique characters: 22

Column: SizeOfHeapReserve
Number of unique characters: 44

Column: SizeOfHeapCommit
Number of unique characters: 14

Column: LoaderFlags
Number of unique characters: 6

Column: NumberOfRvaAndSizes
Number of unique characters: 4

Column: class
Number of unique characters: 2
We observe that the 2 columns e_res and e_res2 contains missing values and the remaining all the columns are clean. Also upon observing the dataset, we find that the dataset contains many columns which has only 1 unique value and thus it shows the particular column is redundant in analysing the class and thus we remove them
new_col = []
for col in df.columns:
    if len(df[col].unique())==1:
        continue
    new_col.append(col)
df = df[new_col]
df.shape
(5184, 52)
Feature extraction#
Feature Extraction aims to reduce the number of features in a dataset by creating new features from the existing ones (and then discarding the original features). These new reduced set of features should then be able to summarize most of the information contained in the original set of features.
X, y = df[df.columns[:-1]].values, df[df.columns[-1]]
titles = []
cases = []

titles.append("SelecKBest Chi2")
cases.append(SelectKBest(chi2,k=5))

titles.append("SelecKBest Mutual info")
cases.append(SelectKBest(mutual_info_classif,k=10))

titles.append("SelectPercentile Chi2")
cases.append(SelectPercentile(chi2, percentile=10))

titles.append("SelectPercentile Mutual info")
cases.append(SelectPercentile(mutual_info_classif, percentile=10))

kfold = StratifiedKFold(n_splits=10, random_state=42, shuffle=True)

for title, case in zip(titles, cases):
    estimators = [(title, case), ('svm', SVC(kernel='linear', C=10, max_iter=80, random_state=42))]
    clf = Pipeline(estimators)
    scores = cross_val_score(clf, X, y, cv=kfold, scoring="f1")
    print(title)
    print('Mean =',scores.mean(), 'Standard Deviation =', scores.std())
SelecKBest Chi2
Mean = 0.5016410853464106 Standard Deviation = 0.30119022569595993
SelecKBest Mutual info
Mean = 0.5855614374108522 Standard Deviation = 0.2746254124773457
SelectPercentile Chi2
Mean = 0.5016410853464106 Standard Deviation = 0.30119022569595993
SelectPercentile Mutual info
Mean = 0.28790384285103954 Standard Deviation = 0.3433342028459363
Based on the above mean and Standard deviation of the f1-score, we select SelecKBest Mutual info for Feature selection#
X_pca = SelectKBest(mutual_info_classif,k=10).fit_transform(X, y)
Train the model#
We will be choosing Random Forest, SVM and J48 Decision Tree models to train the dataset
from sklearn.ensemble import RandomForestClassifier
from sklearn.svm import SVC
from sklearn.tree import DecisionTreeClassifier
import sklearn.metrics as metrics
def False_Positive(y, y_pred):
    cnf_matrix = confusion_matrix(y, y_pred)
    FP = cnf_matrix.sum(axis=0) - np.diag(cnf_matrix)
    FN = cnf_matrix.sum(axis=1) - np.diag(cnf_matrix)
    TP = np.diag(cnf_matrix)
    TN = cnf_matrix.sum() - (FP + FN + TP)
    FP = FP.astype(float)
    FN = FN.astype(float)
    TP = TP.astype(float)
    TN = TN.astype(float)
    FPR = FP/(FP+TN)
    print('False Positive Rate =', FPR)

def ROC(X_t, y_t, model):
    probs = model.predict_proba(X_t)
    preds = probs[:,1]
    fpr, tpr, threshold = metrics.roc_curve(y_t, preds)
    roc_auc = metrics.auc(fpr, tpr)
    plt.title('Receiver Operating Characteristic')
    plt.plot(fpr, tpr, 'b', label = 'AUC = %0.2f' % roc_auc)
    plt.legend(loc = 'lower right')
    plt.plot([0, 1], [0, 1],'r--')
    plt.xlim([0, 1])
    plt.ylim([0, 1])
    plt.ylabel('True Positive Rate')
    plt.xlabel('False Positive Rate')
    plt.show()

def execute(model, X_train, X_val, X_test, y_train, y_val, y_test, name, show=1, pr=1):
    if pr:
        print('Model-name:', name)
    model.fit(X_train, y_train)

    y_pred = model.predict(X_val)

    if show:
        print('\nClassification Report Validation\n')
        print(classification_report(y_val, y_pred))
    if pr:
        False_Positive(y_val, y_pred)
        print('\nAccuracy Validation\n')
        print(metrics.accuracy_score(y_val, y_pred))
    if show:
        ROC(X_val, y_val, model)

    y_pred = model.predict(X_test)
    if show:
        print('\nClassification Report Test\n')
        print(classification_report(y_test, y_pred))
    if pr:
        False_Positive(y_test, y_pred)
        print('\nAccuracy Test\n')
        print(metrics.accuracy_score(y_test, y_pred))
    if show:
        ROC(X_test, y_test, model)
    if pr:
        print()
    return metrics.accuracy_score(y_test, y_pred)

def initialize():
    rf = RandomForestClassifier(max_depth=2, random_state=0)
    svm = SVC(random_state=0, probability=True)
    dt = DecisionTreeClassifier(random_state=0)
    return [rf, svm, dt], ['Random Forest', 'SVM', 'J48 Decision Tree']
Cross Validation, Improve results and Present results#
from sklearn.model_selection import train_test_split
from sklearn.metrics import classification_report
from sklearn.metrics import confusion_matrix

X_train, X_test, y_train, y_test = train_test_split(X_pca, y, test_size=0.3, random_state=0)
X_train, X_val, y_train, y_val = train_test_split(X_train, y_train, test_size=0.2, random_state=0)
1. Holdout method#
print('\nHold out\n')
models, names = initialize()
for model, name in zip(models, names):
    _ = execute(model, X_train, X_val, X_test, y_train, y_val, y_test, name)
Hold out

Model-name: Random Forest

Classification Report Validation

              precision    recall  f1-score   support

           0       0.97      0.87      0.91       356
           1       0.88      0.97      0.92       370

    accuracy                           0.92       726
   macro avg       0.92      0.92      0.92       726
weighted avg       0.92      0.92      0.92       726

False Positive Rate = [0.02972973 0.13483146]

Accuracy Validation

0.918732782369146
Classification Report Test

              precision    recall  f1-score   support

           0       0.96      0.86      0.91       727
           1       0.89      0.97      0.93       829

    accuracy                           0.92      1556
   macro avg       0.92      0.92      0.92      1556
weighted avg       0.92      0.92      0.92      1556

False Positive Rate = [0.03256936 0.13617607]

Accuracy Test

0.9190231362467867
Model-name: SVM

Classification Report Validation

              precision    recall  f1-score   support

           0       0.93      0.51      0.66       356
           1       0.67      0.96      0.79       370

    accuracy                           0.74       726
   macro avg       0.80      0.74      0.73       726
weighted avg       0.80      0.74      0.73       726

False Positive Rate = [0.03783784 0.48876404]

Accuracy Validation

0.7410468319559229
Classification Report Test

              precision    recall  f1-score   support

           0       0.91      0.50      0.64       727
           1       0.68      0.95      0.80       829

    accuracy                           0.74      1556
   macro avg       0.79      0.73      0.72      1556
weighted avg       0.79      0.74      0.72      1556

False Positive Rate = [0.04583836 0.50206327]

Accuracy Test

0.7410025706940874
Model-name: J48 Decision Tree

Classification Report Validation

              precision    recall  f1-score   support

           0       0.97      0.96      0.97       356
           1       0.96      0.97      0.97       370

    accuracy                           0.97       726
   macro avg       0.97      0.97      0.97       726
weighted avg       0.97      0.97      0.97       726

False Positive Rate = [0.02702703 0.03932584]

Accuracy Validation

0.9669421487603306
Classification Report Test

              precision    recall  f1-score   support

           0       0.95      0.95      0.95       727
           1       0.96      0.95      0.95       829

    accuracy                           0.95      1556
   macro avg       0.95      0.95      0.95      1556
weighted avg       0.95      0.95      0.95      1556

False Positive Rate = [0.04704463 0.04951857]

Accuracy Test

0.9517994858611826
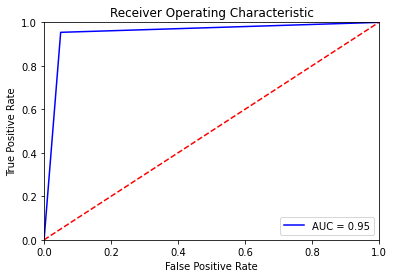
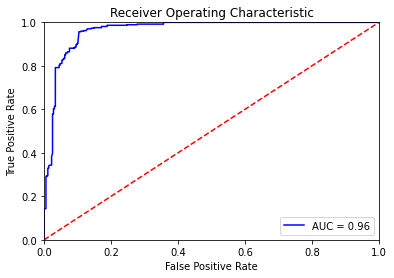
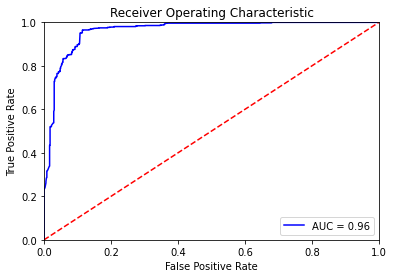
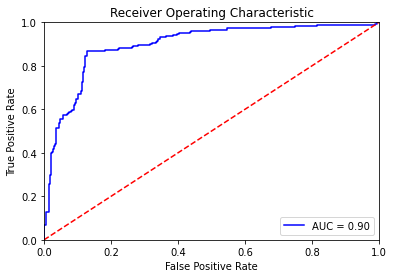
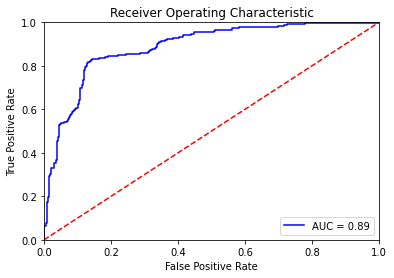
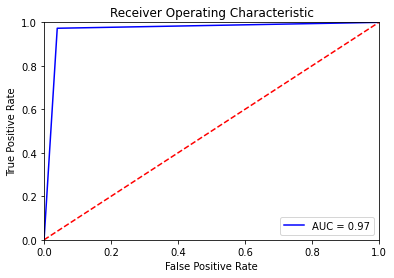
Using Hold out method, the accuracy and false positive rates (along with other evaluation parameters such as precision, recall and F1-Score) is highest and lowest respectively for Decision Tree, thus we conclude that the Decision Tree model performs the best obtaining the accuracy of 95% on validation set and 94% on test dataset. We have also plotted the curve showing ROC plots and AUC value. The AUC value for all the models is above 90% showing that all the models performed extremely well on the dataset
2. k-fold method#
from sklearn.model_selection import KFold

kf = KFold()

count = 1
acc_rf = []
acc_svm = []
acc_dt = []
for train_index, test_index in kf.split(X_pca):
    print('\nk-fold split =',count,'\n')
    count += 1
    X_train, X_test = X_pca[train_index], X_pca[test_index]
    y_train, y_test = y[train_index], y[test_index]
    X_train, X_val, y_train, y_val = train_test_split(X_train, y_train, test_size=0.2, random_state=0)
    models, names = initialize()
    for model, name in zip(models, names):
        acc = execute(model, X_train, X_val, X_test, y_train, y_val, y_test, name, show=0)
        if name[0] == 'R':
            acc_rf.append(acc)
        elif name[0] == 'S':
            acc_svm.append(acc)
        else:
            acc_dt.append(acc)
k-fold split = 1

Model-name: Random Forest
False Positive Rate = [0.01544402 0.19230769]

Accuracy Validation

0.9180722891566265
False Positive Rate = [       nan 0.22372228]

Accuracy Test

0.7762777242044359

Model-name: SVM
False Positive Rate = [0.02702703 0.45833333]

Accuracy Validation

0.810843373493976
False Positive Rate = [       nan 0.50048216]

Accuracy Test

0.49951783992285437

Model-name: J48 Decision Tree
False Positive Rate = [0.02895753 0.02884615]

Accuracy Validation

0.9710843373493976
False Positive Rate = [       nan 0.05593057]

Accuracy Test

0.944069431051109


k-fold split = 2

Model-name: Random Forest
False Positive Rate = [0.01737452 0.18589744]

Accuracy Validation

0.9192771084337349
False Positive Rate = [       nan 0.20250723]

Accuracy Test

0.7974927675988428

Model-name: SVM
False Positive Rate = [0.02702703 0.48717949]

Accuracy Validation

0.8
False Positive Rate = [       nan 0.50144648]

Accuracy Test

0.49855351976856316

Model-name: J48 Decision Tree
False Positive Rate = [0.02702703 0.06089744]

Accuracy Validation

0.9602409638554217
False Positive Rate = [       nan 0.06943105]

Accuracy Test

0.9305689488910318


k-fold split = 3

Model-name: Random Forest
False Positive Rate = [0.03439803 0.12056738]

Accuracy Validation

0.9216867469879518
False Positive Rate = [0.02459016 0.13348946]

Accuracy Test

0.9305689488910318

Model-name: SVM
False Positive Rate = [0.03194103 0.50827423]

Accuracy Validation

0.7253012048192771
False Positive Rate = [0.04098361 0.45901639]

Accuracy Test

0.7868852459016393

Model-name: J48 Decision Tree
False Positive Rate = [0.03685504 0.03546099]

Accuracy Validation

0.963855421686747
False Positive Rate = [0.04098361 0.04215457]

Accuracy Test

0.9585342333654774


k-fold split = 4

Model-name: Random Forest
False Positive Rate = [0.11904762 0.08704453]

Accuracy Validation

0.9
False Positive Rate = [0.10414658        nan]

Accuracy Test

0.8958534233365477

Model-name: SVM
False Positive Rate = [0.02083333 0.5       ]

Accuracy Validation

0.6939759036144578
False Positive Rate = [0.03953713        nan]

Accuracy Test

0.9604628736740598

Model-name: J48 Decision Tree
False Positive Rate = [0.05654762 0.04048583]

Accuracy Validation

0.9530120481927711
False Positive Rate = [0.05689489        nan]

Accuracy Test

0.9431051108968177


k-fold split = 5

Model-name: Random Forest
False Positive Rate = [0.09815951 0.0952381 ]

Accuracy Validation

0.9036144578313253
False Positive Rate = [0.10328185        nan]

Accuracy Test

0.8967181467181468

Model-name: SVM
False Positive Rate = [0.02760736 0.50198413]

Accuracy Validation

0.6843373493975904
False Positive Rate = [0.03861004        nan]

Accuracy Test

0.9613899613899614

Model-name: J48 Decision Tree
False Positive Rate = [0.05214724 0.04365079]

Accuracy Validation

0.9530120481927711
False Positive Rate = [0.05984556        nan]

Accuracy Test

0.9401544401544402
print('\nMean Random forest accuracy test for 5 splits =', sum(acc_rf)/len(acc_rf), '\n')
print('\nMean SVM accuracy test for 5 splits =', sum(acc_svm)/len(acc_svm), '\n')
print('\nMean J48 Decision tree accuracy test for 5 splits =', sum(acc_dt)/len(acc_dt), '\n')
Mean Random forest accuracy test for 5 splits = 0.859382202149801


Mean SVM accuracy test for 5 splits = 0.7413618881314157


Mean J48 Decision tree accuracy test for 5 splits = 0.9432864328717752
Using k-fold method, the accuracy and false positive rates is highest and lowest respectively for Decision Tree, thus we conclude that the Decision Tree model performs the best here obtaining the accuracy of 94% on test dataset
3. Leave one out#
from sklearn.model_selection import LeaveOneOut

loo = LeaveOneOut()

acc_rf = []
acc_svm = []
acc_dt = []
count = 0
for train_index, test_index in loo.split(X_pca):
    X_train, X_test = X_pca[train_index], X_pca[test_index]
    y_train, y_test = y[train_index], y[test_index]
    models, names = initialize()
    for model, name in zip(models, names):
        model.fit(X_train, y_train)
        y_pred = model.predict(X_test)
        acc = metrics.accuracy_score(y_test, y_pred)
        if name[0] == 'R':
            acc_rf.append(acc)
        elif name[0] == 'S':
            acc_svm.append(acc)
        else:
            acc_dt.append(acc)
    count += 1
    if count%100==0:
        break
print('\nMean Random forest accuracy test =', sum(acc_rf)/len(acc_rf), '\n')
print('\nMean SVM accuracy test =', sum(acc_svm)/len(acc_svm), '\n')
print('\nMean J48 Decision tree accuracy test =', sum(acc_dt)/len(acc_dt), '\n')
Mean Random forest accuracy test = 0.9


Mean SVM accuracy test = 0.52


Mean J48 Decision tree accuracy test = 0.98
Using leave one out method, the accuracy is highest for Decision Tree, thus we conclude that the Decision Tree model performs the best here again obtaining the accuracy of 98%+ on test dataset. So, overall comparing all the 3 cross validation methods, the clear winner is Decision Tree model. Just for the sake of information, the worst model was SVM and Random Forest classifier performed almost on an equal ground with Decision Tree.